Regional reports on energy data management
Contents
Introduction
The Toolkit of CitiEnGov project has a major focus on energy data. In the context of CitiEnGov, energy data is being used to, either define different kind of action plans, such as SEAP or SECAP, or to monitor them. This energy data refers to buildings, transport and public lighting and includes data about: 1. energy production and distribution, 2. real energy consumption, 3. estimated energy needs and energy performance.
CitiEnGov project partners reported the information about the availability of energy data in their regions in the frame of a questionnaire. The questionnaire was not limited to project partners, but also addressed to other local stakeholders, such as public authorities, business support organisations, consultants, advisors and researchers. In this way, we were able to get a more comprehensive and balanced overview about the availability of energy data, which is not subject to single opinions or knowledge.
The following sub-sections provide results from the questionnaire and they are presented in diagrams and text. Questions and desired inputs have been organized in the following sections about energy data:
- energy sources, production and distribution
- energy sources, production and distribution
- energy consumption and energy performance for municipal buildings
- energy consumption and energy performance for other buildings
- energy consumption for transport
- energy consumption for public lighting
- CO2 emission factors
Energy sources, production and distribution
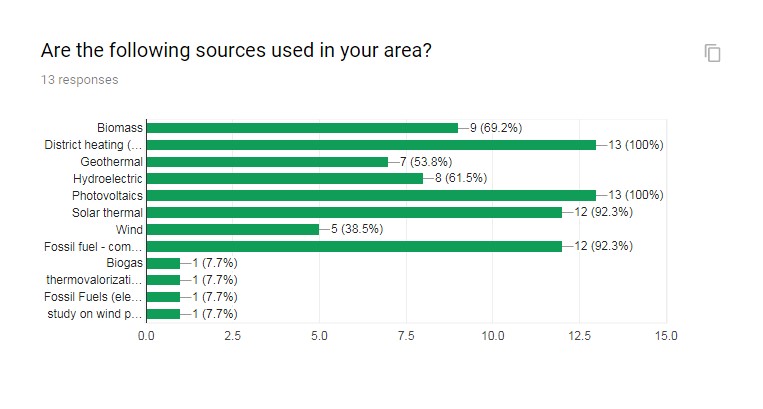
The following diagram shows different energy sources used in different regions. We can see from the diagram that biomass, district heating, photovoltaics, solar thermal and fossil fuels are well represented in all regions with hydroelectric and geothermal falling just a little behind. It has to be noted, that the data does not provide us with quantative values, but only gives an information whether the energy source is used. For example, solar thermal energy source is used in almost all areas, but represents just a fraction of total energy used from fossil fuels.
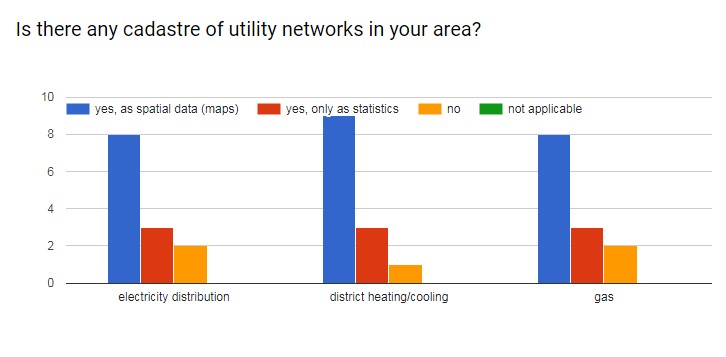
The following diagram shows the availability of cadastres of utility networks. Cadastres are mostly presented as spatial data, but in some cases, only as a statistic data. In most areas these applications are hard to master and are quite complicated. For example, Slovenia has two systems at national level, that are not connected and that do not allow users to download data for more than one unit at the time.
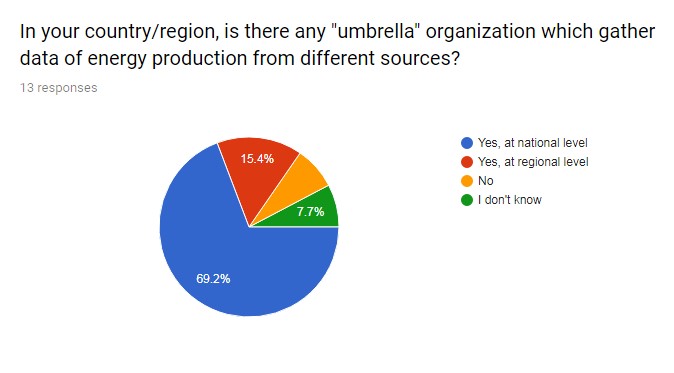
As we can see from the diagram, in most countries there are organizations, that are responsible for gathering data about energy production from different sources. Only about 15% of respondents have reported, that there is also an organization that gathers data on regional level.
The diagrams show that there are similarities in the mentioned areas, between different regions, especially when it comes to organizations responsible for data about energy production from different sources (see last diagram). Majority of countries/regions only have data available on national level. Not gathering data on regional level could be seen as a problem, as it is quite difficult to plan energy projects on local level, if there are only documents about energy data on national level (such is the case in Slovenia, where there are a lot of small municipalities and they cannot obtain any relevant local data).
Energy consumption and energy performance for municipal buildings
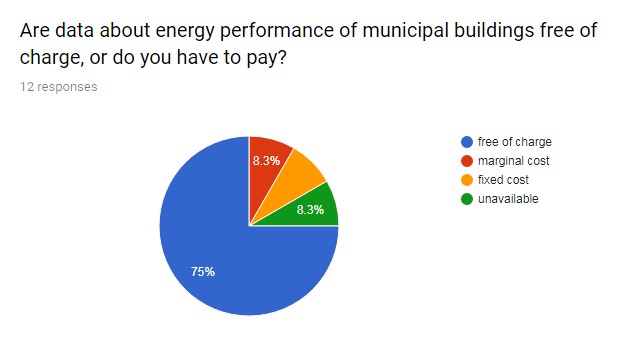
In most countries the data about energy performance is free of charge but is in most cases not publicly available. In the case of LEAG (that gathers data for 11 municipalities) data is free of charge but only if municipality that is the owner of the data allows it.
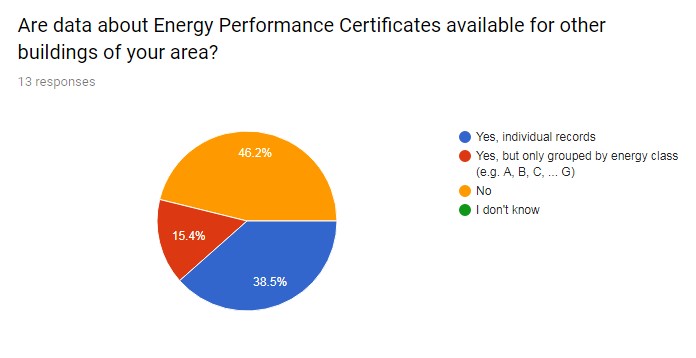
In appx. half countries the data about energy performance certificates are not available. In SLO energy performance certificates are public documents and are also publicly available (downloadable from the web page in pdf form), but the system is designed in a way that users cannot get the data of the district in tabular format. In some reigns that is a possibility and is also very useful for evaluating energy related documents (eg. LEC, SEAP).
Energy consumption and energy performance for other buildings
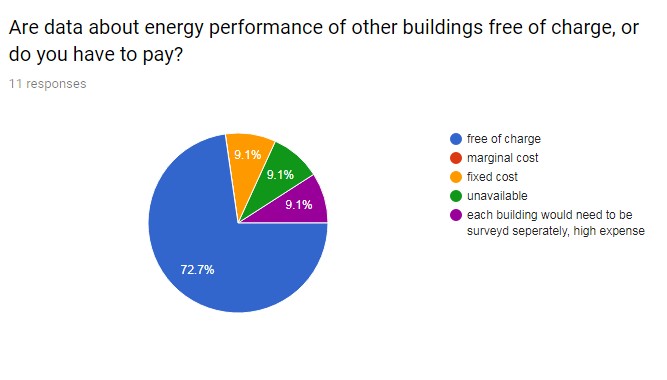
Data about energy consumption and energy performance of private buildings is quite a big problem because there are always issues about privacy, accuracy and what kind of data to collect. Data is across EU mostly free of charge but the question is what data.
Are this calculated or real energy consumption? The reader should take it into account that if we are talking about calculated energy consumption of the building (that can be summarized from energy performance certificates) or real energy consumption of the building, that there could be big a difference. This is especially true for buildings that consume under 60 kWh/m2 of heat per year.
Boilers are devices that produce heat for heating or preparation of hot water. In most EU countries the boilers are examined once a year by a chimney companies. Electric boilers are devices for heating hot water using only electricity. Other boilers use gas to heat the water, whilst an electric boiler can be used in off-grid areas, or where the gas supply is either not wanted or not possible.
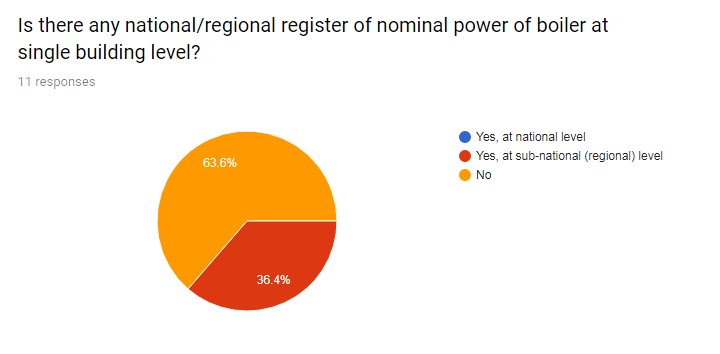
Whenever we convert electricity directly to heat the sustainability of conversion is questionable. According to European Environment Agency appx. ¾ of all produced electricity in EU comes from power plants that use nuclear or fossil fuels. So, with electric boilers we use appx. 3 kWh of fossil fuels to produce 1 kWh of electricity. Using a heat pump instead helps to lower the consumption of primary energy and also the need power. Despite these findings there is no national or regional register of nominal power of boilers at single building level.
Energy consumption for transport
Final energy consumption for transport accounts for appx. 33% in EU according to European environment Agency.
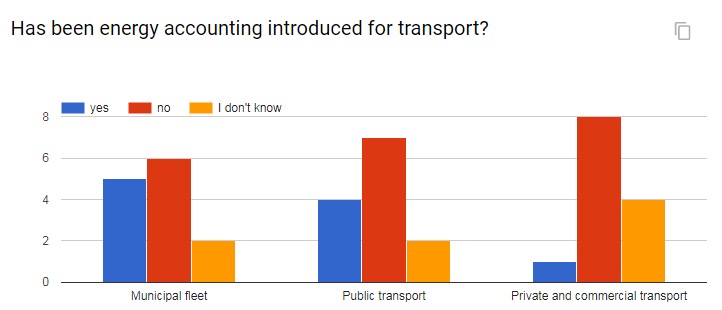
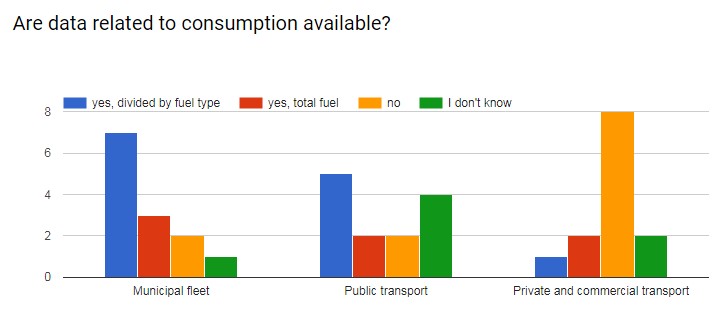
The annual energy consumption of transport in the EEA-33 grew by 38 % between 1990 and 2007. Road transport accounts for the largest share of energy consumption, with 74 % of the total EEA-33 demand in 2015. Despite a decrease in energy consumption since the recession, road transport energy consumption in 2015 was still 28 % higher than in 1990. Despite these numbers Energy accounting for transport for municipal fleet was introduced for appx. only half of all respondents.
The number lowers for public transport and especially for private and commercial transport.
The data about fuel consumption are mostly available for municipal fleet and public transport. For private and commercial transport, the data is mostly not available. The problem is that according to European environment Agency the share of energy usage for cars is appx 50 % of all energy used for transport compared to buses and trains that uses less than 10 % all energy used for transport.
So, in order to address the challenges of transport private and commercial transport should be taken into account.
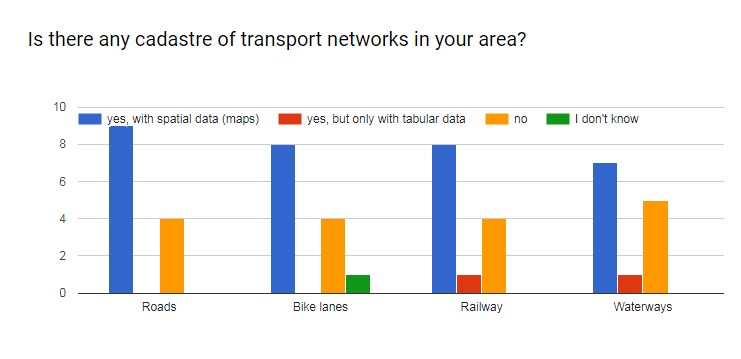
Cadastre of transport is available in most areas but there is a lack of tabular data. For this reason, it is very hard to get appropriate qualitative data for elaboration of LECs and SEAPs.
Energy consumption for public lighting
According to Prelovsek [3] public lighting represents a relatively small proportion of the overall energy consumption in the country as it amounts to around 0.7 %.
The effort in reducing it, however, offers significant impact especially as public lighting is often the biggest public energy consumer in a municipality. Furthermore, investment in public lighting tends to have a quick payback time especially when the lighting equipment is rather obsolete.
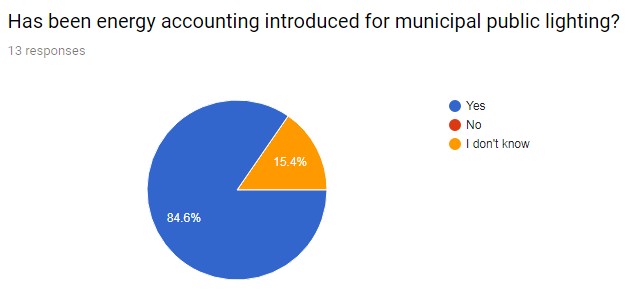
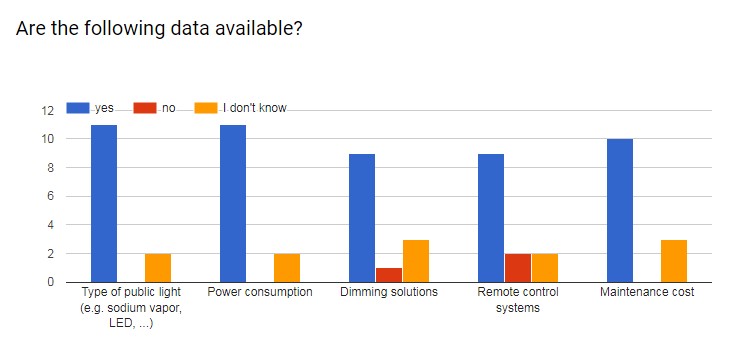
As we can se from the diagram below the energy accounting for public lightning was introduced in most municipalities. The reason for that is also simpler data capture compared to transport.
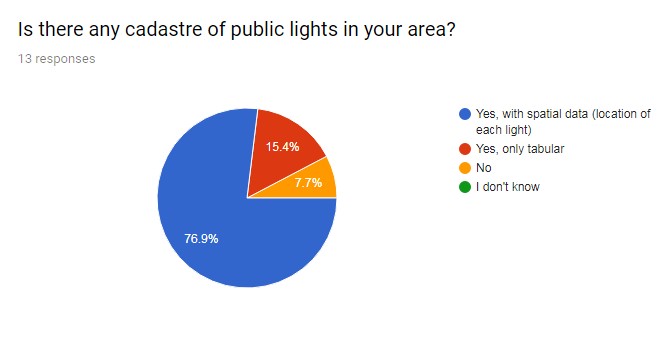
As we can see from diagram below cadastre for public lightning is implemented in appx ¾ regions. Problem that arises in some countries is the same as with all cadastres.
Cadastres mostly contain all the important data about the lightning. Sometimes the data is out of date, because some retrofits are made at the level of single lamp. There is also a problem regarding traceability of changes that were made in the past. In some municipalities the retrofit of public lightning was successful but the area where the public lightning is implemented also grow. This should also be taken into account.
CO2 emission factors
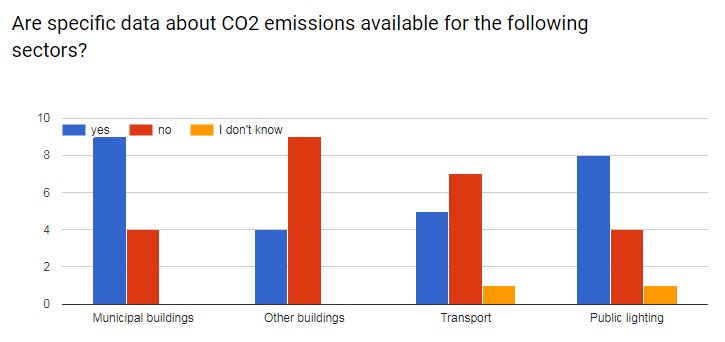
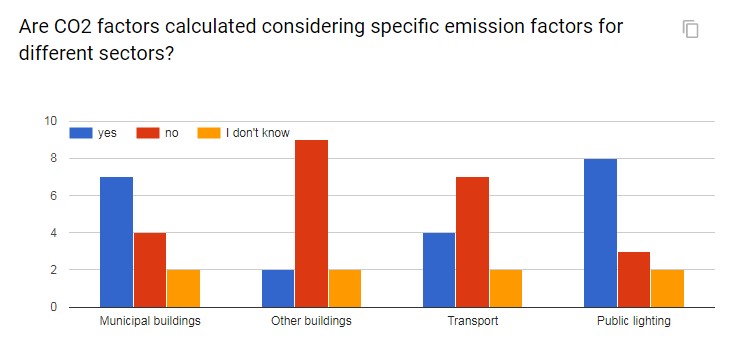
CO2 emission factors are mostly available where there is data about type and quantity of energy used is available. For this reason, most of the data is available for municipal buildings and public lighting.
CO2 emission factors are mostly calculated from conversion factors that are defined at the country level. The factors depend on the share of the final energy usage for electricity production. Thus, more electricity is produced from renewable energy resources lower are the factors.
