|
|
| Line 1: |
Line 1: |
| − | = Introduction = | + | = Introduction = |
| − | This page summarizes the tools available in the CitiEnGov regions related to energy data.
| + | In this page results are presented from questionnaire collected about '''Energy data''' available in the regions of CitiEnGov partners. |
| | | | |
| − | The findings have been provided by partners within the project deliverable D.T1.2.3. | + | The questionnaire was addressed (but not limited) to CitiEnGov partners and other local stakeholders (e.g. public authorities, business support organisations, consultants, advisors, researchers...), in order to have a more comprehensive and balanced overview, independent from personal opinions or knowledge. |
| | | | |
| − | == Austria ==
| + | The concept of "Energy data" include data about: |
| | + | * energy production and distribution |
| | + | * energy real consumption |
| | + | * energy estimated needs and performances |
| | | | |
| | + | In CitiEnGov context, energy data are data (raw/detailed or statistics/aggregated) being to be used for defining energy plans (e.g. SEAP/SECAP) or to monitor them. Energy data refer to buildings, transport and public lighting. |
| | | | |
| − | == Croatia ==
| + | Questions have been organized in the following sections: |
| | + | # general section (questions about the respondent) |
| | + | # energy sources, production and distribution |
| | + | # energy consumption and energy performance for municipal buildings |
| | + | # energy consumption and energy performance for other buildings |
| | + | # energy consumption for transport |
| | + | # energy consumption for public lighting |
| | + | # CO2 emission factors |
| | | | |
| | + | The following sub-sections provide results and diagrams from the survey. |
| | | | |
| − | == Germany ==
| |
| | | | |
| | + | == Energy sources, production and distribution == |
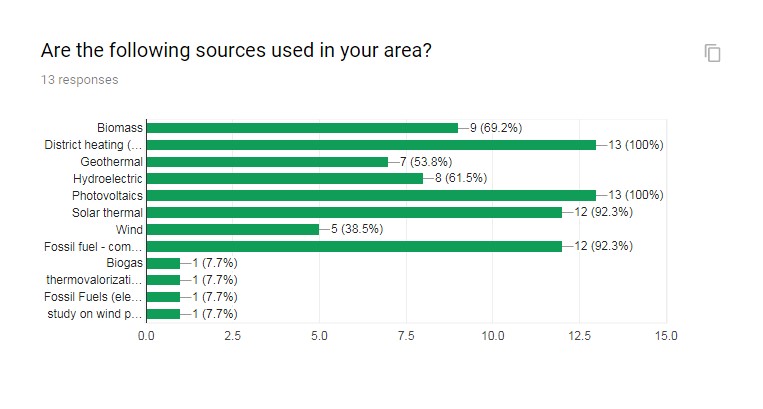
| | + | As we can see from the following diagram biomass, district heating, photovoltaics, solar thermal and fossil fuels are well represented in all countries and districts that were analysed. But one should be careful with this data because it does not show us quantitative values eg. solar thermal is used in almost all areas but is just a fraction of total energy used from fossil fuels. |
| | | | |
| − | == Hungary ==
| + | [[File:Figura1.jpg|center|frame|Used sources in different areas]] |
| | | | |
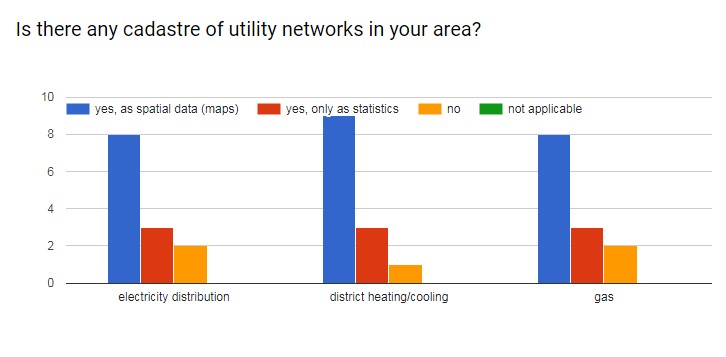
| | + | Cadastre of utility networks are mostly presented as spatial data. In some cases, there is only statistics. In most areas these applications are hard to master and are quite complicated. For example, in SLO we have two systems that are not connected and that doesn’t allow user to download data for more than one unit at the time. |
| | | | |
| − | == Italy ==
| + | [[File:Figura2.jpg|center|frame|Cadastre of utility network]] |
| − | === Energy monitoring vision ===
| |
| − | The energy monitoring vision is declined on three specific application scenarios:
| |
| − | * Energy monitoring for the purposes of the municipal Urban Planning office
| |
| − | * Energy monitoring for the fulfilment of Sustainable Energy Action Plans requirements
| |
| − | * Energy monitoring for the purposes of the municipal Energy office
| |
| | | | |
| − | '''Energy monitoring for Urban Planning'''
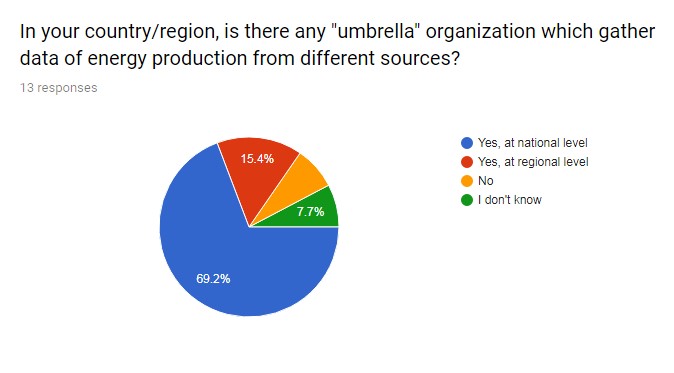
| + | In most countries there are organizations responsible for gathering data for energy consumption at national level but only ¼ of respondents have an organization that gathered data at regional level. This is quite a big problem because mostly we have some documents that are evaluated on national or local level and for example in SLO there are a lot of small municipalities where is very hard to plan energy projects (because of their small size). |
| | | | |
| − | Urban Planning in Italy, but also in the Emilia Romagna Region and more specifically in the territory of Ferrara over the last decade, has clearly shifted its attention from the expansion of territory to urban regeneration and refurbishment/retrofitting of buildings, due to many concomitant factors (economic crisis, decline in births, excess supply of housing, need for smaller residences, soil consumption and all the problems related).
| + | [[File:Figura3.jpg|center|frame|Level of organization that gathers energy production from different sources]] |
| − | In this contest, being aware of the state of the existing building stock and its energy properties is crucial in order to:
| |
| − | # Plan structural interventions through public works with municipality funds (three-year public works plans) and external funding (regional and/or European funds) or through partnerships with providers (e.g. for geothermal -or gas- network extension);
| |
| − | # Design information and awareness raising on activities aimed at reducing costs and pollution (atmospheric emissions but also urban heat islands);
| |
| − | # Provide targeted incentives (economic incentives, volumetric incentives), as did the Building Regulation of the Municipality of Ferrara), or fiscal incentives, as foreseen in the new Urban Planning Law being approved.
| |
| − | The aim is thus to obtain, for all the buildings in the municipal area:
| |
| − | * The aim is thus to obtain, for all the buildings in the municipal area:
| |
| − | * Main use for the building (+ in the case of residential use: the number of people living there and age; for other uses: the type of activity);
| |
| − | * Annual energy consumption (electricity, cooling, hot water, heating);
| |
| − | * Type and status of building installations using energy (boiler, heating system, air conditioning, heat pump) and producing it (renewable energy sources, RES);
| |
| − | * Information about building renovation and energy refurbishment of buildings
| |
| − | * Energy performance data (e.g. energy performance certificates)
| |
| − | Through the knowledge of these data, it is possible to identify where and how to act and to define energy planning on a municipal scale.
| |
| − | An added value of project CitiEnGov could be to start:
| |
| − | * Intersectoral collaboration within the administration, in order to produce and acquire harmonized data; But not just data, also know-how and services to the citizen;
| |
| − | * Similarly, a process between the partners involved (entities, providers, region, stakeholders) to define a protocol for mutual exchange of data
| |
| | | | |
| | | | |
| − | '''Energy monitoring for Sustainable Energy/Climate Action Plans (SEAP/SECAP) requirements'''
| + | == Energy consumption and energy performance for municipal buildings == |
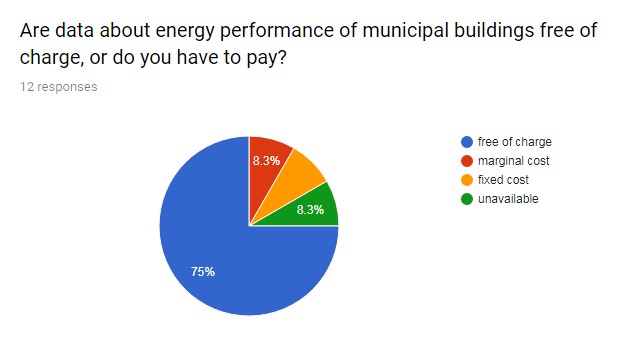
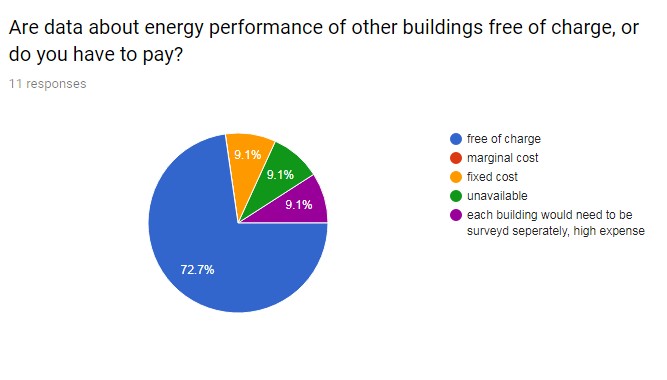
| | + | In most countries the data about energy performance is free of charge but is in most cases not publicly available. In the case of LEAG (that gathers data for 11 municipalities) data is free of charge but only if municipality that is the owner of the data allows it. |
| | | | |
| − | Energy data useful for developing and monitoring a SEAP can be summarized in:
| + | [[File:Figura4.jpg|center|frame|Cost for data about energy performance of buildings]] |
| − | * Energy building consumption divided by sector of activity (residential, public illumination, industry, transport, agriculture) and by type of fuel;
| |
| − | * Local renewable and non-renewable thermal production data (photovoltaic plants, biogas plants, waste treatment plants, thermal solar plants, vegetable oil, biofuels, other biomasses, geothermal energy);
| |
| − | * District heating network data;
| |
| − | * Comparison of electricity and thermal consumption per capita in relation to other cities in the same region;
| |
| − | * Consumption data of the municipality buildings;
| |
| − | * Consumption data for the Industry sector outside of ETS (Emissions Trading System);
| |
| − | * Energy saving data obtained for each year by energy operators (e.g. ESCO)
| |
| | | | |
| − | '''Energy monitoring for the Energy Office'''
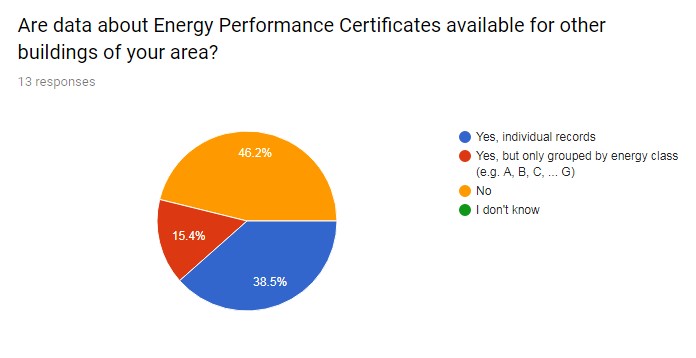
| + | In appx. half countries the data about energy performance certificates are not available. In SLO energy performance certificates are public documents and are also publicly available (downloadable from the web page in pdf form), but the system is designed in a way that users cannot get the data of the district in tabular format. In some reigns that is a possibility and is also very useful for evaluating energy related documents (eg. LEC, SEAP). |
| | | | |
| − | For the Energy Office activities it would be important to have accurate information about heating and air conditioning systems for all the buildings in the municipal territory.
| + | [[File:Figura5.jpg|center|frame|Data about energy performance certificates]] |
| − | Emilia Romagna Region is developing CRITER Census, a regional cadastre for thermal plants and installations which should include data on: georeferenced installation position, nominal power, number of devices, energy carrier, plant type (heating, cooling, heat pump).
| |
| | | | |
| | + | == Energy consumption and energy performance for other buildings == |
| | + | Data about energy consumption and energy performance of private buildings is quite a big problem because there are always issues about privacy, accuracy and what kind of data to collect. Data is across EU mostly free of charge but the question is what data. |
| | | | |
| | + | Are this calculated or real energy consumption? The reader should take it into account that if we are talking about calculated energy consumption of the building (that can be summarized from energy performance certificates) or real energy consumption of the building, that there could be big a difference. This is especially true for buildings that consume under 60 kWh/m2 of heat per year. |
| | | | |
| − | === Available data ===
| + | [[File:Figura6.jpg|center|frame|Cost of energy performance data for private buildings]] |
| | | | |
| − | '''Short explanation of the tables'''
| + | Boilers are devices that produce heat for heating or preparation of hot water. In most EU countries the boilers are examined once a year by a chimney companies. Electric boilers are devices for heating hot water using only electricity. Other boilers use gas to heat the water, whilst an electric boiler can be used in off-grid areas, or where the gas supply is either not wanted or not possible. |
| | | | |
| − | * '''How is the data organized:''' It could be aggregated, detailed with specific locations, individually recorded per different units, spatial data like maps etc.
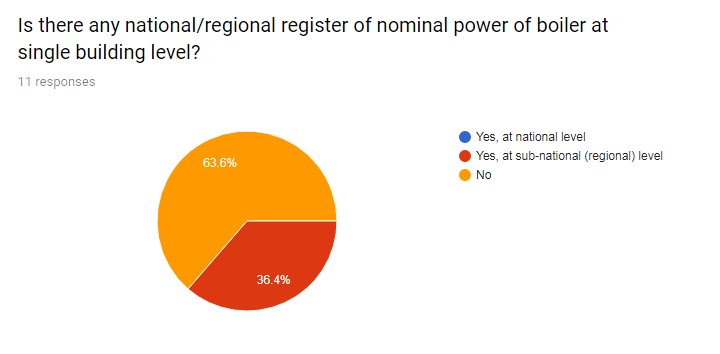
| + | Whenever we convert electricity directly to heat the sustainability of conversion is questionable. According to European Environment Agency appx. ¾ of all produced electricity in EU comes from power plants that use nuclear or fossil fuels. So, with electric boilers we use appx. 3 kWh of fossil fuels to produce 1 kWh of electricity. Using a heat pump instead helps to lower the consumption of primary energy and also the need power. Despite these findings there is no national or regional register of nominal power of boilers at single building level. |
| − | * '''Who is the data provider''': the entity or a person that provides the specific data (municipality, departments, agencies, businesses, individuals etc.)
| |
| − | * '''How frequently is new data made available:''' regularly, periodically and how often, or on request.
| |
| − | * '''Access restrictions:''' is the dataset free, open and available to public or are there any licences needed to use the data.
| |
| − | * '''Data access point:''' URL of the data or contact person who is responsible for access to the resource.
| |
| | | | |
| | + | [[File:Figura7.jpg|center|frame|National or regional register of nominal power of boilers]] |
| | | | |
| | + | == Energy consumption for transport == |
| | + | Final energy consumption for transport accounts for appx. 33% in EU according to European environment Agency. |
| | | | |
| − | '''Energy sources (production)'''
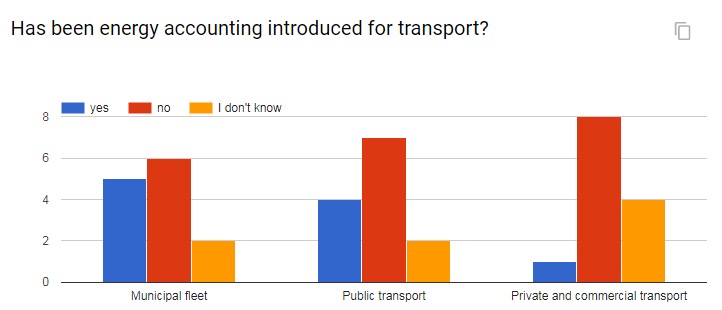
| + | The annual energy consumption of transport in the EEA-33 grew by 38 % between 1990 and 2007. Road transport accounts for the largest share of energy consumption, with 74 % of the total EEA-33 demand in 2015. Despite a decrease in energy consumption since the recession, road transport energy consumption in 2015 was still 28 % higher than in 1990. Despite these numbers Energy accounting for transport for municipal fleet was introduced for appx. only half of all respondents. |
| | | | |
| − | Each table provides information about a specific energy source and the data of that energy source. The tables about utility network types refer to the data of the networks of different energy sources.
| + | The number lowers for public transport and especially for private and commercial transport. |
| | | | |
| − | {| class="wikitable"
| + | [[File:Figura8.jpg|center|frame|Energy accounting for transport]] |
| − | | style="font-style: italic;" | '''Energy source/s'''
| |
| − | | style="text-align: center;" | District heating: combined geothermal and thermovalorization waste
| |
| − | |- | |
| − | | style="font-style: italic;" | '''How is the data organized?'''
| |
| − | | style="text-align: center;" | Detailed, point of delivery
| |
| − | |-
| |
| − | | style="font-style: italic;" | '''Who is the data provider?'''
| |
| − | | style="text-align: center;" | Gruppo HERA
| |
| − | |-
| |
| − | | style="font-style: italic;" | '''How frequently is new data made available?'''
| |
| − | | style="text-align: center;" | On request
| |
| − | |-
| |
| − | | style="font-style: italic;" | '''Access restrictions'''
| |
| − | | style="text-align: center;" | Data can be used only for institutional purposes
| |
| − | |-
| |
| − | | style="font-style: italic;" | '''Data access point'''
| |
| − | | style="text-align: center;" | Emanuele.Gessi@gruppohera.it
| |
| − | |-
| |
| − | |}
| |
| | | | |
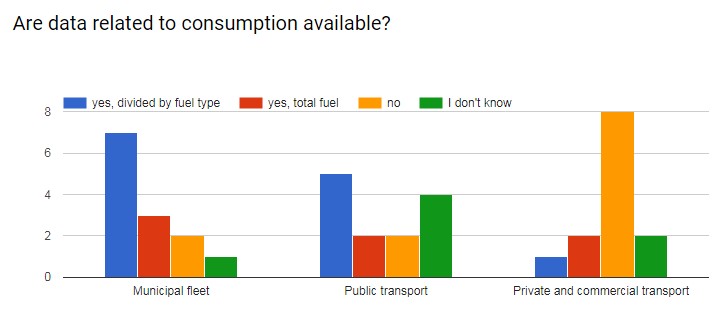
| | + | The data about fuel consumption are mostly available for municipal fleet and public transport. For private and commercial transport, the data is mostly not available. The problem is that according to European environment Agency the share of energy usage for cars is appx 50 % of all energy used for transport compared to buses and trains that uses less than 10 % all energy used for transport. |
| | | | |
| − | {| class="wikitable"
| + | So, in order to address the challenges of transport private and commercial transport should be taken into account. |
| − | | style="font-style: italic;" | '''Energy source/s'''
| |
| − | | style="text-align: center;" | Photovoltaics, solar thermal, RES
| |
| − | |-
| |
| − | | style="font-style: italic;" | '''How is the data organized?'''
| |
| − | | style="text-align: center;" | individual records
| |
| − | |-
| |
| − | | style="font-style: italic;" | '''Who is the data provider?'''
| |
| − | | style="text-align: center;" | GSE (Gestore Servizi energetici)
| |
| − | |-
| |
| − | | style="font-style: italic;" | '''How frequently is new data made available?'''
| |
| − | | style="text-align: center;" | once a year
| |
| − | |-
| |
| − | | style="font-style: italic;" | '''Access restrictions'''
| |
| − | | style="text-align: center;" | Free of charge
| |
| − | |-
| |
| − | | style="font-style: italic;" | '''Data access point'''
| |
| − | | style="text-align: center;" | http://www.gse.it/it/salastampa/news/Pages/online-atlaimpianti-il-sistema-informativo-degli-impianti-a-fonti-rinnovabili-.aspx
| |
| − | |-
| |
| − | |}
| |
| | | | |
| | + | [[File:Figura9.jpg|center|frame|Data about energy consumption for transport]] |
| | | | |
| − | {| class="wikitable"
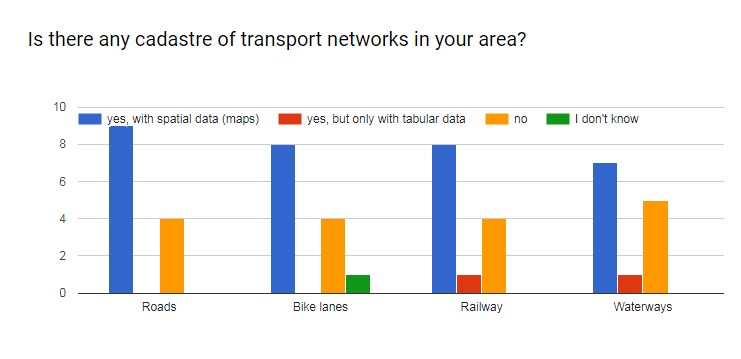
| + | Cadastre of transport is available in most areas but there is a lack of tabular data. For this reason, it is very hard to get appropriate qualitative data for elaboration of LECs and SEAPs. |
| − | | style="font-style: italic;" | '''Utility network type/s'''
| |
| − | | style="text-align: center;" | electricity distribution
| |
| − | |-
| |
| − | | style="font-style: italic;" | '''How is the data organized?'''
| |
| − | | style="text-align: center;" | Detailed, as spatial data (maps) Related data: voltage
| |
| − | |-
| |
| − | | style="font-style: italic;" | '''Who is the data provider?'''
| |
| − | | style="text-align: center;" | Emilia Romagna Region
| |
| − | |-
| |
| − | | style="font-style: italic;" | '''How frequently is new data made available?'''
| |
| − | | style="text-align: center;" | regularly (usually once a year)
| |
| − | |-
| |
| − | | style="font-style: italic;" | '''Access restrictions'''
| |
| − | | style="text-align: center;" | free
| |
| − | |-
| |
| − | | style="font-style: italic;" | '''Data access point'''
| |
| − | | style="text-align: center;" | http://geoportale.regione.emilia-romagna.it/it/catalogo/dati-cartografici/cartografia-di-base/database-topografico-regionale/reti-sottoservizi/rete-elettrica
| |
| − | |-
| |
| − | |}
| |
| | | | |
| − | | + | [[File:Figura10.jpg|center|frame|Cadastre of transport networks]] |
| − | {| class="wikitable"
| |
| − | | style="font-style: italic;" | '''Utility network type/s'''
| |
| − | | style="text-align: center;" | Gas
| |
| − | |-
| |
| − | | style="font-style: italic;" | '''How is the data organized?'''
| |
| − | | style="text-align: center;" | Detailed, as spatial data (maps)
| |
| − | |-
| |
| − | | style="font-style: italic;" | '''Who is the data provider?'''
| |
| − | | style="text-align: center;" | Hera - Rete SNAM
| |
| − | |-
| |
| − | | style="font-style: italic;" | '''How frequently is new data made available?'''
| |
| − | | style="text-align: center;" | On request
| |
| − | |-
| |
| − | | style="font-style: italic;" | '''Access restrictions'''
| |
| − | | style="text-align: center;" | free, but restricted to Municipality
| |
| − | |-
| |
| − | | style="font-style: italic;" | '''Data access point'''
| |
| − | | style="text-align: center;" | fabio.guerzoni@snamretegas.it
| |
| − | |-
| |
| − | |}
| |
| − | | |
| − | | |
| − | {| class="wikitable"
| |
| − | | style="font-style: italic;" | '''Utility network type/s'''
| |
| − | | style="text-align: center;" | District heating | |
| − | |- | |
| − | | style="font-style: italic;" | '''How is the data organized?'''
| |
| − | | style="text-align: center;" | Detailed, as spatial data (maps)
| |
| − | |-
| |
| − | | style="font-style: italic;" | '''Who is the data provider?'''
| |
| − | | style="text-align: center;" | Gruppo HERA
| |
| − | |-
| |
| − | | style="font-style: italic;" | '''How frequently is new data made available?'''
| |
| − | | style="text-align: center;" | On request
| |
| − | |-
| |
| − | | style="font-style: italic;" | '''Access restrictions'''
| |
| − | | style="text-align: center;" | free, but restricted to Municipality
| |
| − | |-
| |
| − | | style="font-style: italic;" | '''Data access point'''
| |
| − | | style="text-align: center;" | Emanuele.Gessi@gruppohera.it
| |
| − | |-
| |
| − | |}
| |
| − | | |
| − | | |
| − | | |
| − | '''CO2 emission factors'''
| |
| − | | |
| − | The table provides information about the factors of CO2 emissions and the data that refers to these factors.
| |
| − | | |
| − | {| class="wikitable"
| |
| − | ! colspan="2" style="font-style: italic;" style="text-align: left;" | '''CO2 emission factors'''
| |
| − | |-
| |
| − | | style="font-style: italic;" | '''How is the data organized?'''
| |
| − | | style="text-align: center;" | data available at municipal level for different sectors: municipal buildings, other buildings, transport, public lighting
| |
| − | |-
| |
| − | | style="font-style: italic;" | '''Who is the data provider?'''
| |
| − | | style="text-align: center;" | Local energy agency; Emilia Romagna Region
| |
| − | |-
| |
| − | | style="font-style: italic;" | '''How frequently is new data made available?'''
| |
| − | | style="text-align: center;" | every few years
| |
| − | |-
| |
| − | | style="font-style: italic;" | '''Access restrictions'''
| |
| − | | style="text-align: center;" | free, open and available to the public
| |
| − | |-
| |
| − | | style="font-style: italic;" | '''Data access point'''
| |
| − | | style="text-align: center;" | http://servizi.comune.fe.it/6482/il-paes-dell-associazione-intercomunale-terre-estensi - paes.terreestensi@comune.fe.it
| |
| − | |-
| |
| − | |}
| |
| − | | |
| − | | |
| − | | |
| − | === Missing data ===
| |
| − | '''What is missing for Urban Planning purposes'''
| |
| − | | |
| − | In general, the interest of administrators at every level on energy data has increased, but there is still no structured plan for the production, maintenance, transmission and standardization of building energy data.
| |
| − | | |
| − | What follows are some considerations on the current status of data availability:
| |
| − | * There is a good availability of data concerning buildings (surface area, volume, type of use, residents);
| |
| − | * In terms of consumption, data is available from some sources (the National Tax Agency), but there are difficulties in transmitting data; sometimes data is not of good quality; and finally, data are not harmonized with municipal data (toponym, land register);
| |
| − | * Emilia Romagna Region owns and manages the database of energy performance certificates, but there are difficulties in obtaining these data even for municipalities (and only on request). Moreover, data is partial and of poor quality;
| |
| − | * Regarding the energy data in renovated building, a monitoring was started in January 2016 (georeferencing the intervention, typology, expected energy performance, use of renewable sources);
| |
| − | | |
| − | {| class="wikitable"
| |
| − | | style="font-style: italic;" | '''Nature of data'''
| |
| − | | style="text-align: center;" | monitoring of the accounting systems for energy consumption in multi occupied buildings
| |
| − | |-
| |
| − | | style="font-style: italic;" | '''Why is it missing?'''
| |
| − | | style="text-align: center;" | The municipality does not have an archiving system; Perhaps available from other Entities (ENEA, National Tax Agency) but not available at present
| |
| − | |-
| |
| − | |}
| |
| − | | |
| − | | |
| − | {| class="wikitable"
| |
| − | | style="font-style: italic;" | '''Nature of data'''
| |
| − | | style="text-align: center;" | Regional Cadastre of thermal plants
| |
| − | |-
| |
| − | | style="font-style: italic;" | '''Why is it missing?'''
| |
| − | | style="text-align: center;" | The cadastre in Ferrara will be active from 2019 - http://energia.regione.emilia-romagna.it/servizi-on-line/criter
| |
| − | |-
| |
| − | |}
| |
| − | | |
| − | | |
| − | {| class="wikitable"
| |
| − | | style="font-style: italic;" | '''Nature of data'''
| |
| − | | style="text-align: center;" | Wood/Pellet Stove consumption
| |
| − | |-
| |
| − | | style="font-style: italic;" | '''Why is it missing?'''
| |
| − | | style="text-align: center;" | They are not censed
| |
| − | |-
| |
| − | |}
| |
| − | | |
| − | | |
| − | '''What is missing for Sustainable Energy Action Plans (SEAP) requirements'''
| |
| − | | |
| − | {| class="wikitable"
| |
| − | | style="font-style: italic;" | '''Nature of data'''
| |
| − | | style="text-align: center;" | Electricity consumption data
| |
| − | |-
| |
| − | | style="font-style: italic;" | '''Why is it missing?'''
| |
| − | | style="text-align: center;" | The provider does not provide electricity consumption about category: TRANSPORT for small-medium cities such as Ferrara
| |
| − | |-
| |
| − | |}
| |
| − | | |
| − | | |
| − | {| class="wikitable"
| |
| − | | style="font-style: italic;" | '''Nature of data'''
| |
| − | | style="text-align: center;" | Natural gas consumption data
| |
| − | |-
| |
| − | | style="font-style: italic;" | '''Why is it missing?'''
| |
| − | | style="text-align: center;" | The provider does not provide data divided by SECTOR but by type of contract (use kitchen, use of kitchen and heating and HDW, tertiary). The data do not specify if consumption is directed to single unit building or shared unit buildings
| |
| − | |-
| |
| − | |}
| |
| − | | |
| − | | |
| − | {| class="wikitable"
| |
| − | | style="font-style: italic;" | '''Nature of data'''
| |
| − | | style="text-align: center;" | Other fuels data
| |
| − | |-
| |
| − | | style="font-style: italic;" | '''Why is it missing?'''
| |
| − | | style="text-align: center;" | Data are estimated for the municipality on the basis of the provincial consumption data provided by the National Petroleum Bulletin - http://dgsaie.mise.gov.it/dgerm/bollettino.asp
| |
| − | |-
| |
| − | |}
| |
| − | | |
| − | | |
| − | {| class="wikitable"
| |
| − | | style="font-style: italic;" | '''Nature of data'''
| |
| − | | style="text-align: center;" | Local Energy production data
| |
| − | |-
| |
| − | | style="font-style: italic;" | '''Why is it missing?'''
| |
| − | | style="text-align: center;" | There is no single referent who collects and provides data
| |
| − | |-
| |
| − | |}
| |
| − | | |
| − | | |
| − | {| class="wikitable"
| |
| − | | style="font-style: italic;" | '''Nature of data'''
| |
| − | | style="text-align: center;" | Fossil fuels outside the public network
| |
| − | |-
| |
| − | | style="font-style: italic;" | '''Why is it missing?'''
| |
| − | | style="text-align: center;" | They are not censed
| |
| − | |-
| |
| − | |}
| |
| − | | |
| − | | |
| − | | |
| − | === Required ICT tools ===
| |
| − | '''Tool requirements for Urban Planning purposes'''
| |
| − | | |
| − | In the municipality of Ferrara the management system of building permits has been implemented with a section dedicated to the monitoring of energy data related to building renovations (and new constructions). The aim is the monitoring of improvements in the energy performance of the buildings.
| |
| − | Moreover, a new webgis platform is under construction, which will include a section - called “energy dashboard” - about energy data consumption of buildings, offering the possibility of visualizing a map of real annual energy consumption at the building level.
| |
| − | About the ICT tools, the Municipality needs:
| |
| − | * GIS support for data produced and maintained by the municipality;
| |
| − | * Treatment and standardization for data produced by other entities;
| |
| − | * Support in the definition of technical specifications for data transmission with other public administrations;
| |
| − | | |
| − | '''Tool requirements for Sustainable Energy Action Plans (SEAP) requirements'''
| |
| − | | |
| − | A very useful tool would be one that every two years allows to compare the goals of the SEAP between the city of Ferrara and the other experiences of the SEAP in the neighbouring territories in terms of proposed objectives, results of implemented actions, savings targets and renewable energies, CO2 emission factors use.
| |
| − | | |
| − | '''Tool requirements for Energy Office purposes'''
| |
| − | The energy office needs to improve the management software currently used for consumption forecast and the final energy reporting (for each thermal season) of the buildings under its management (municipal buildings). The software should simulate the building's energy needs during the occupancy hours for individual buildings and help in defining the correct allocation of energy consumption for individual users in multi-user buildings.
| |
| − | | |
| − | | |
| − | == Poland ==
| |
| − | | |
| − | | |
| − | == Slovenia ==
| |
The questionnaire was addressed (but not limited) to CitiEnGov partners and other local stakeholders (e.g. public authorities, business support organisations, consultants, advisors, researchers...), in order to have a more comprehensive and balanced overview, independent from personal opinions or knowledge.
In CitiEnGov context, energy data are data (raw/detailed or statistics/aggregated) being to be used for defining energy plans (e.g. SEAP/SECAP) or to monitor them. Energy data refer to buildings, transport and public lighting.
The following sub-sections provide results and diagrams from the survey.
As we can see from the following diagram biomass, district heating, photovoltaics, solar thermal and fossil fuels are well represented in all countries and districts that were analysed. But one should be careful with this data because it does not show us quantitative values eg. solar thermal is used in almost all areas but is just a fraction of total energy used from fossil fuels.
Cadastre of utility networks are mostly presented as spatial data. In some cases, there is only statistics. In most areas these applications are hard to master and are quite complicated. For example, in SLO we have two systems that are not connected and that doesn’t allow user to download data for more than one unit at the time.
In most countries there are organizations responsible for gathering data for energy consumption at national level but only ¼ of respondents have an organization that gathered data at regional level. This is quite a big problem because mostly we have some documents that are evaluated on national or local level and for example in SLO there are a lot of small municipalities where is very hard to plan energy projects (because of their small size).
In most countries the data about energy performance is free of charge but is in most cases not publicly available. In the case of LEAG (that gathers data for 11 municipalities) data is free of charge but only if municipality that is the owner of the data allows it.
In appx. half countries the data about energy performance certificates are not available. In SLO energy performance certificates are public documents and are also publicly available (downloadable from the web page in pdf form), but the system is designed in a way that users cannot get the data of the district in tabular format. In some reigns that is a possibility and is also very useful for evaluating energy related documents (eg. LEC, SEAP).
Data about energy consumption and energy performance of private buildings is quite a big problem because there are always issues about privacy, accuracy and what kind of data to collect. Data is across EU mostly free of charge but the question is what data.
Are this calculated or real energy consumption? The reader should take it into account that if we are talking about calculated energy consumption of the building (that can be summarized from energy performance certificates) or real energy consumption of the building, that there could be big a difference. This is especially true for buildings that consume under 60 kWh/m2 of heat per year.
Boilers are devices that produce heat for heating or preparation of hot water. In most EU countries the boilers are examined once a year by a chimney companies. Electric boilers are devices for heating hot water using only electricity. Other boilers use gas to heat the water, whilst an electric boiler can be used in off-grid areas, or where the gas supply is either not wanted or not possible.
Whenever we convert electricity directly to heat the sustainability of conversion is questionable. According to European Environment Agency appx. ¾ of all produced electricity in EU comes from power plants that use nuclear or fossil fuels. So, with electric boilers we use appx. 3 kWh of fossil fuels to produce 1 kWh of electricity. Using a heat pump instead helps to lower the consumption of primary energy and also the need power. Despite these findings there is no national or regional register of nominal power of boilers at single building level.
Final energy consumption for transport accounts for appx. 33% in EU according to European environment Agency.
The annual energy consumption of transport in the EEA-33 grew by 38 % between 1990 and 2007. Road transport accounts for the largest share of energy consumption, with 74 % of the total EEA-33 demand in 2015. Despite a decrease in energy consumption since the recession, road transport energy consumption in 2015 was still 28 % higher than in 1990. Despite these numbers Energy accounting for transport for municipal fleet was introduced for appx. only half of all respondents.
The number lowers for public transport and especially for private and commercial transport.
The data about fuel consumption are mostly available for municipal fleet and public transport. For private and commercial transport, the data is mostly not available. The problem is that according to European environment Agency the share of energy usage for cars is appx 50 % of all energy used for transport compared to buses and trains that uses less than 10 % all energy used for transport.
So, in order to address the challenges of transport private and commercial transport should be taken into account.
Cadastre of transport is available in most areas but there is a lack of tabular data. For this reason, it is very hard to get appropriate qualitative data for elaboration of LECs and SEAPs.
